記得上一節是介紹如何用 WAPT 做壓測 Mobile API。這一節我們就來介紹一下如何用 Apache JMeter 做 Mobile API 的壓力測試。
在開始實做之前,我們先來介紹一下 Apache JMeter:
- 100%由 Java 開發的測是工具。
- 開放原碼軟體 (Open Source)。
- 支援效能測試、功能測試和負載測試。
- 原先設計做 Web 測試,現在已延伸可以做其它功能測試。
- 對附載及效能測,支援多項服務和協定:HTTP, HTTPS, SOAP, REST, FTP, JDBC, LDAP, JMS, SMTP, POP3, IMAP, NoSQL, Commands, Shell Scripts and TCP...
- GUI介面方便建立測試計畫和除錯。
- 高擴充性核心等等...
缺點:


Step 8: Unzip file "apache-jmeter-2.13.zip"

Step 9: Double click the file "jmeter.bat" for start JMetrer.
C:\"Download Folder" \apache-jmeter-2.13\bin

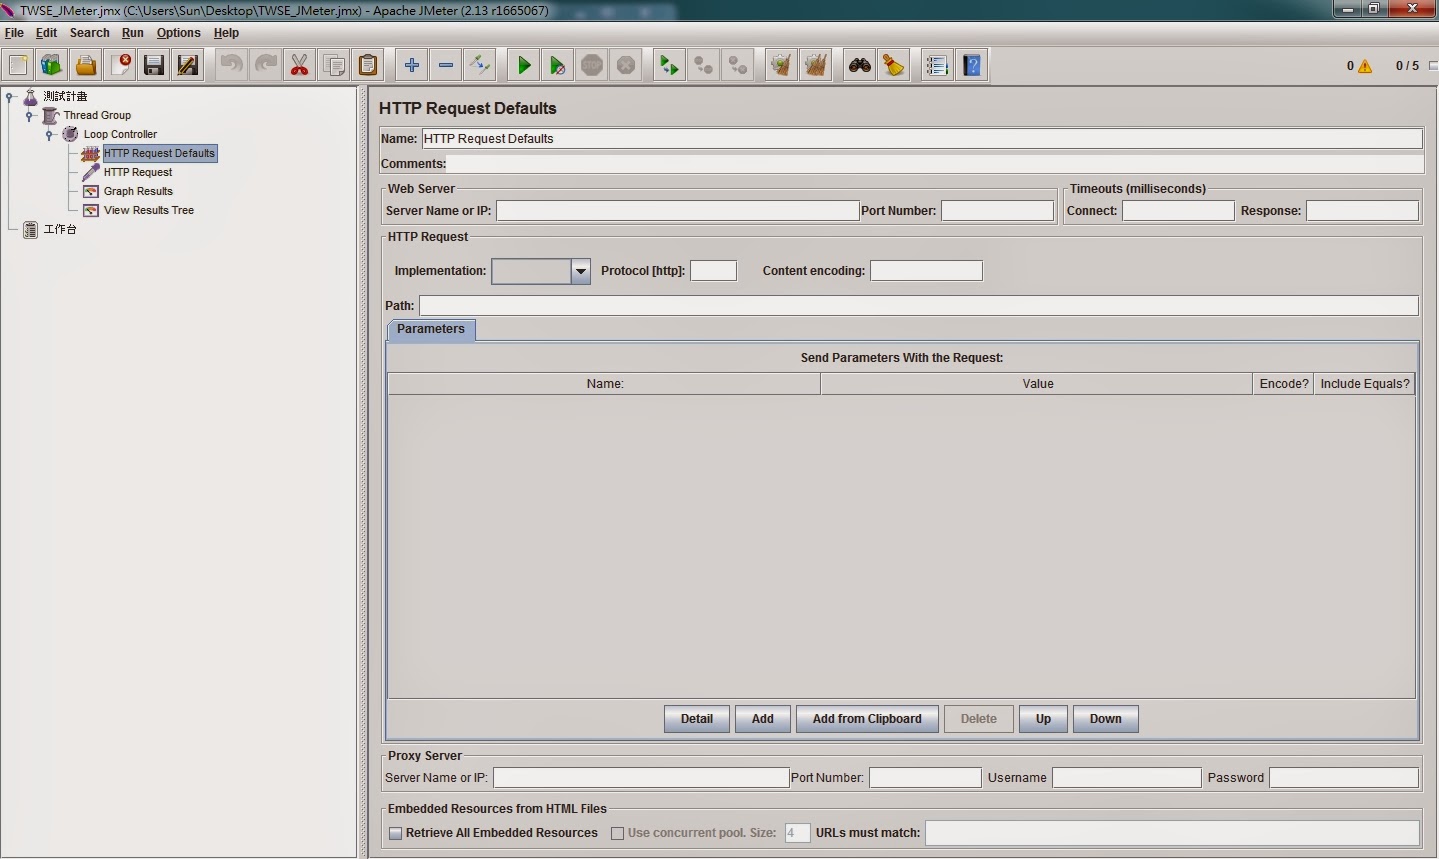
Step 10: Show the JMeter main GUI as below.

Step 11: Create the first test plan.
Test Plan | Add | Threads(Users) | Thread Group

Step 12: Set every 5 seconds(blue), ramp-up 5 VUs(yellow) and loop 100 times(red) then total 500 VUs.

Step 13: If want to repeat the VUs for this test plan set in red. For our case just set loop 1 time means doesn't want any VUs to do repeat test.
Thread Group | Add | Logic Controller | Loop Controller


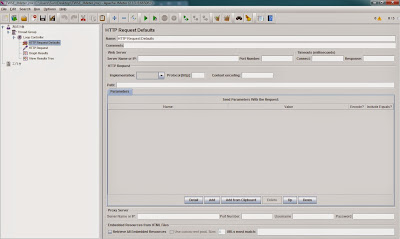
Step 14: If need to test more APIs for HTTP Request, we can set the defaults for the HTTP Request then separate the APIs HTTP Request. For our case just create a "HTTP Request Defaults" don't do any setup with this.
Loop Controller | Add | Config Element | HTTP Request Defaults

Step 15: Create the API "HTTP Request"
Loop Controller | Add | Sampler | HTTP Request

Step 16: Set IP for HTTP server in red, Path in green and API parameters in blue. Click "Add" in yellow to add the parameters.

Step 17: Create the graph results.
Loop Controller | Add | Listener | Graph Results

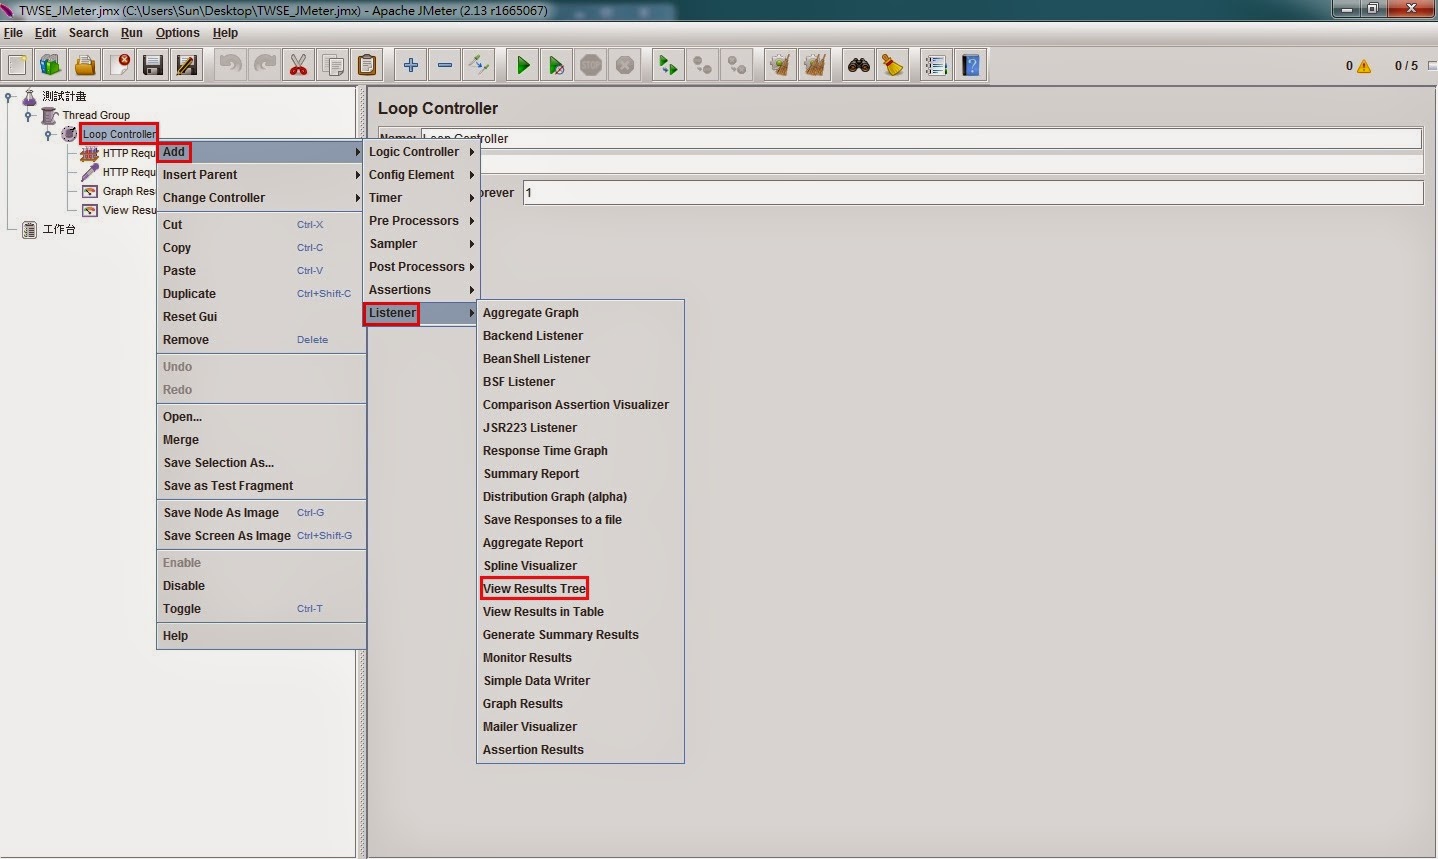
Step 18: Create the results tree for recording the results bit by bit.
Loop Controller | Add | Listener | View Results Tree

Step 19: Click the icon  on navigation bar to save this test plan.


Step 22: Graph Results of "No of Samples" means total requests, "Average" means average of response time, "Deviation" means deviation of response time if the number near 0 will be the best. "Throughput /minute" means per minute of response requests if the number much higher will be the better of the performance.

Step 23: List of Results Tree.

Step 24: Check the back-end of management GUI page to verify the requests.

介紹到這裡相信各位對於 JMeter 這套壓測工具,應該有了初步的認識和基本的使用方式。
這套壓測工具就如同上圖所見,並沒有很清楚或漂亮的圖形表現,這也是 Freeware 的測試工具普遍存在的問題,但是就單純的以一個實用性的壓力測試工具來說,JMeter 的測試表現算是一個蠻專業的測試工具,唯一的缺點就是在製作測試報告時,需要花較多的時間在圖表和測試報告的說明上面。
這一節 JMeter 的說明我們就先介紹到這裡,以後如果還有需要,我們再來做更深入的說明。那我們就下次見~ 掰掰!!!
~ See you ~
參考出處:
https://www.java.com/
http://jmeter.apache.org/
- JMeter 並不像瀏覽器可以執行 CSS 或 JavaScript 等等瀏覽器語言。
- 因受 thread 的限制,所以無法長時間執行測試。
- Debug 較不易。
- 測試報告不夠完整性。
- 需要安裝 JRE 6 以上版本才能執行。
現在就來開始我們這一節的實作說明:

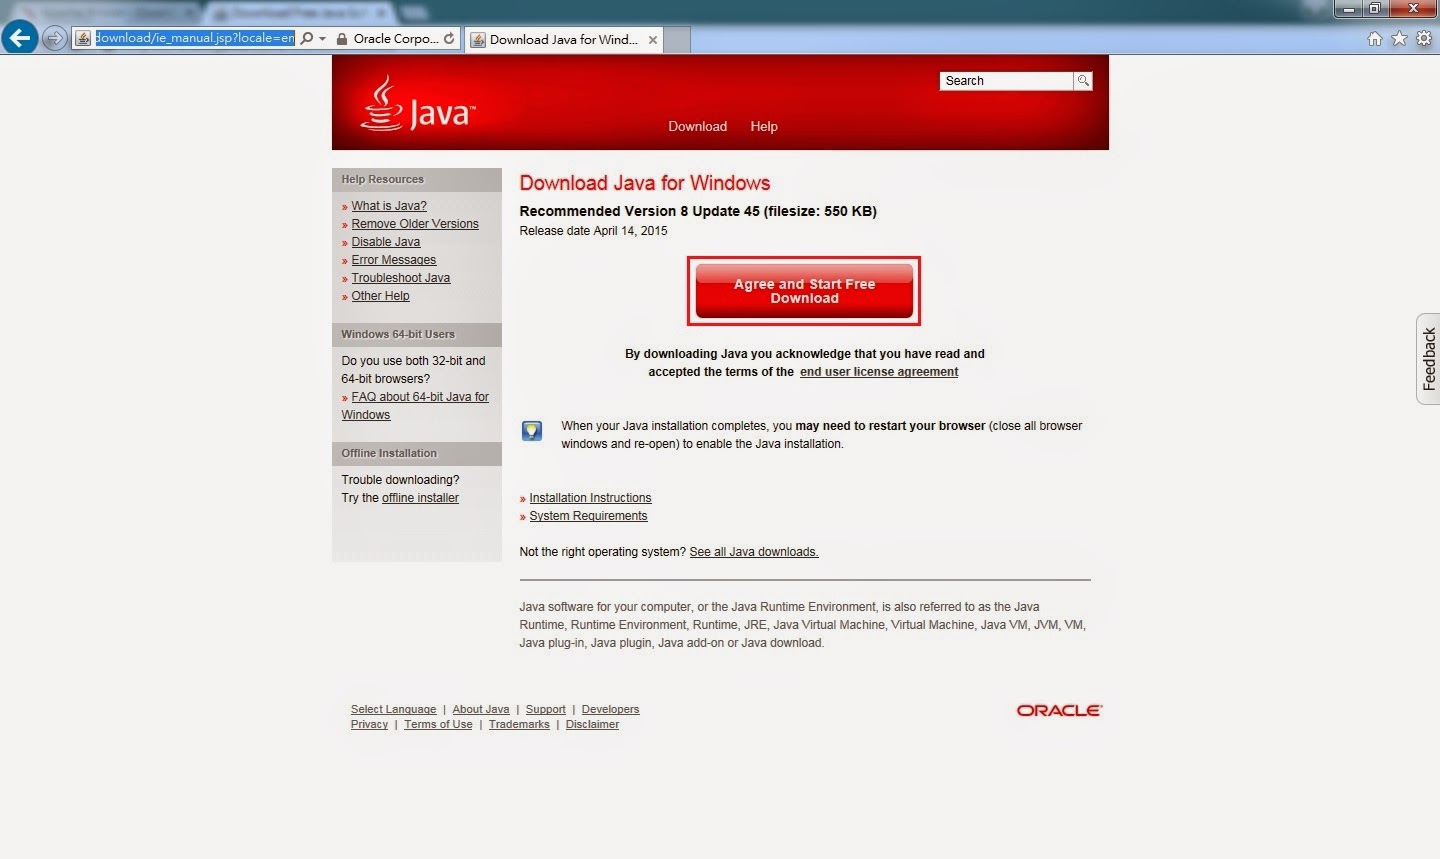
Step 1: Download JRE from the official website.
https://www.java.com/en/download/ie_manual.jsp?locale=en
Step 2: Install JRE from download folder then double click the installation file "JavaSetup8u45.exe"

Step 3: Click "Yes" for continuous.

Step 4: Click "Install" for the installation.

Step 5: Un-tick the check box then click "Next"


Step 6: Click "Close" for finished the JRE installation.

Step 7: Download from the link as below or the official website.
https://www.java.com/en/download/ie_manual.jsp?locale=en


C:\"Download Folder" \apache-jmeter-2.13\bin

Test Plan | Add | Threads(Users) | Thread Group


Thread Group | Add | Logic Controller | Loop Controller


Loop Controller | Add | Config Element | HTTP Request Defaults

Loop Controller | Add | Sampler | HTTP Request


Loop Controller | Add | Listener | Graph Results

Loop Controller | Add | Listener | View Results Tree

Step 20: Click the icon  to start the test plan.

Step 21: Click the icon  to clear all results.


這套壓測工具就如同上圖所見,並沒有很清楚或漂亮的圖形表現,這也是 Freeware 的測試工具普遍存在的問題,但是就單純的以一個實用性的壓力測試工具來說,JMeter 的測試表現算是一個蠻專業的測試工具,唯一的缺點就是在製作測試報告時,需要花較多的時間在圖表和測試報告的說明上面。
這一節 JMeter 的說明我們就先介紹到這裡,以後如果還有需要,我們再來做更深入的說明。那我們就下次見~ 掰掰!!!
~ See you ~
參考出處:
https://www.java.com/
http://jmeter.apache.org/
沒有留言:
張貼留言